
Accurate particle size distribution (PSD) data can provide a significant amount of information about the nature of a particulate emissions source. One means of collecting accurate particle size distribution data uses an in-situ cascade impactor.
Figure 1 shows the actual samples from a well-performed in-situ cascade impactor test. Each photo shows particulate matter (the tiny dark spots) deposited on ultra-pure quartz substrates that occupy each of the stages of a cascade impactor. The particle size of the particulate collected in each stage gets successively smaller moving from the left to the right in the top photo (Photo 1) and continuing from left to right in the bottom left photo (Photo 2). The lower right photo (Photo 3) is the final backup filter and contains the smallest particles.
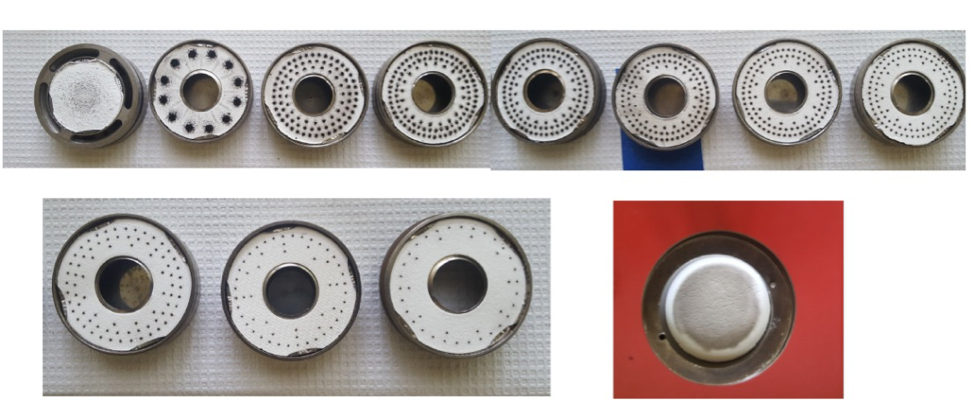
Figure 1: A University of Washington Mark V Cascade Impactor Collected Sample
Cumulative Mass Percentage PSD Data Plot
The initial information obtained from analyzing the samples in these photos is a gravimetrically determined set of particle size cuts (D50) called a particle size distribution. When sampled from an industrial process, the distribution can be used to determine how much particulate matter of each particle size cut that a new piece of air pollution control (APC) equipment would need to remove from the gas stream to meet a target emissions value. For a controlled process, the distribution can tell us how efficiently an existing APC device is operating.
Figure 2 shows a cumulative mass plot of a spline-fitted PSD data set. Note the X-axis title of “Aerodynamic Diameter.” Particle size distribution data are presented in terms of either the aerodynamic or the Stokes diameter of the particles. The aerodynamic diameter is a mathematically derived parameter that allows the irregularly shaped particles to be represented as idealized spheres of unit density. The Stokes diameter is a similar construct that represents the particles as spheres having the same density and settling velocity as the actual particles. It is important to know which diameter basis is being represented when evaluating PSD data.
The “mass mean diameter (MMD)” is another parameter typically used to evaluate PSD data. The MMD is the particle diameter at which half of the sample mass is comprised of particles with smaller diameters. In the case represented in Figure 2, the MMD is approximately 2.5 microns. The smaller the MMD, the more difficult it is for an APC system to remove the particles from the gas stream. This trend tends to go up exponentially as particle size decreases. Once the MMD is below about 5 µm, a significant investment of money and energy will be required to remove a substantial fraction of the entrained particulate matter.
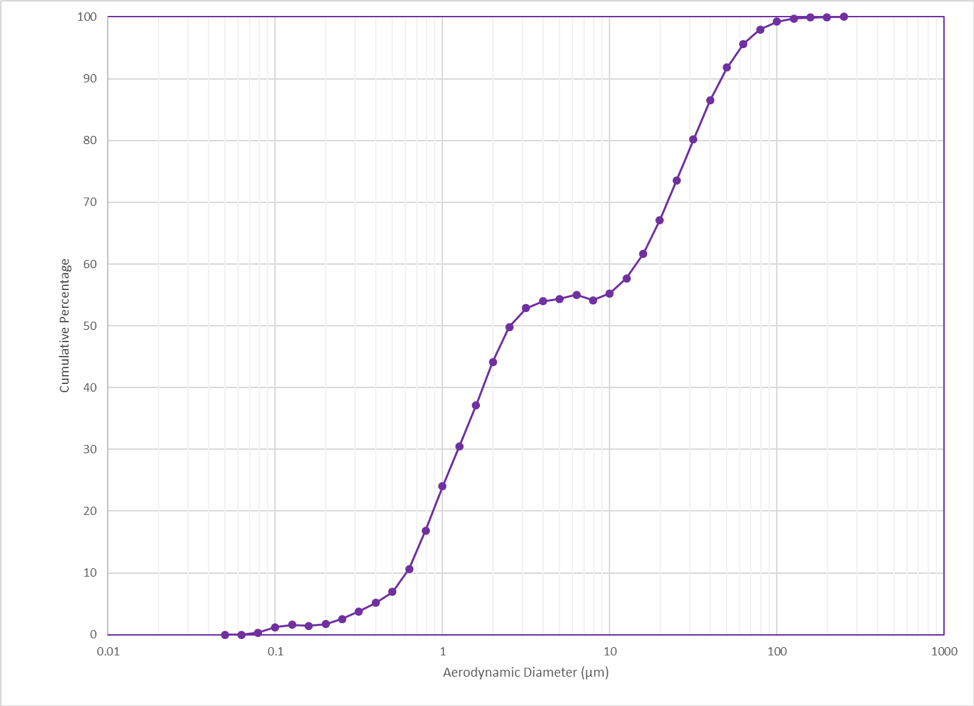
Figure 2: Cumulative Mass Percentage PSD Data Plot
dM/dLogD PSD Data Plot
Another common way to represent PSD data is the use of a dM/dLogD graph. The dM/dLogD plot presents the mass concentration on a linear Y-axis versus particle size on a logarithmic X-axis. By using a linear scale for the Y-axis, the area under the curve between any two particle sizes equals the total concentration of particulate existing between the diameters.
This type of plot is particularly useful because it provides insight into the type and prominence of formation mechanisms of the captured particulate matter. Figure 3 is a dM/dLogD plot that shows a trimodal distribution, with the three distinct peaks reflecting the three modes of particle formation from a combustion process.
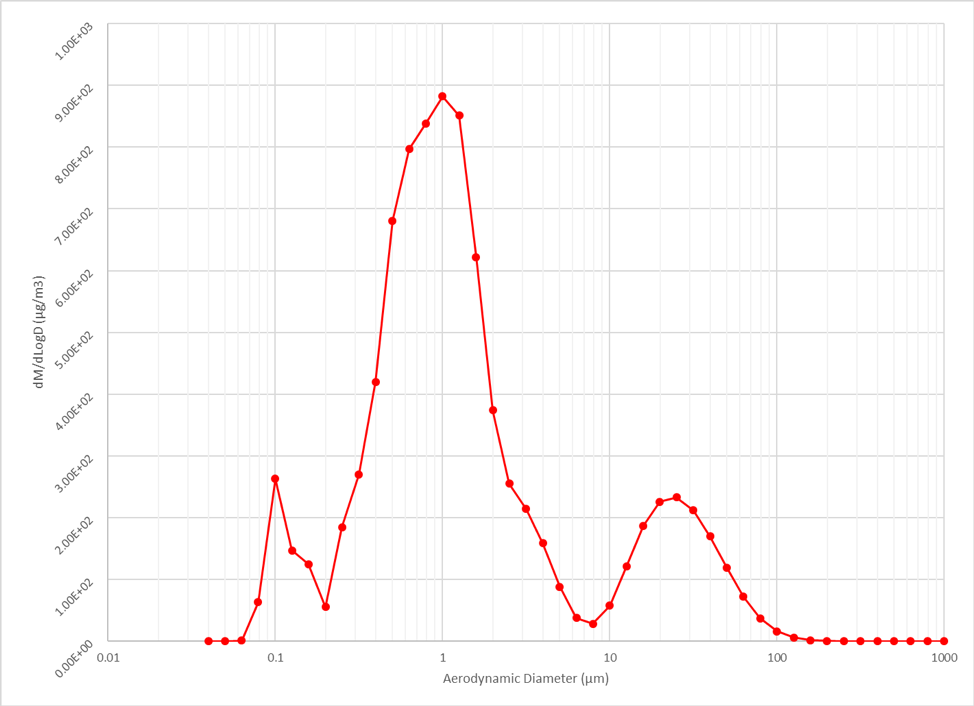
Figure 3: dM/dLogD PSD Data Plot
The peak on the far-right side centered at 20 µm is typical of “mechanically” generated particles. These are usually caused by processes such as grinding or crushing. In the combustion case, they are the larger pieces of material that have not fully combusted and still retain a significant portion of combustible content. The peak can also represent agglomerations of finer particles that act aerodynamically as larger particles.
The large center peak of approximately 1 µm that dominates the particle size distribution is that of the inert products of combustion. This mass of material is approximately 3½ times as prevalent in the gas stream as that represented by the other two peaks. A substantial portion of this material would need to be removed to effectively “control” particulate emissions from this source.
The third, leftmost, peak centered at 0.1 µm is generated by particles that have been formed by vapor phase condensation. Gas phase compounds have cooled enough to form solid material in the gas stream. It is typical for these to form in the sub-micron size range. These particles, if present in a significant quantity, present a significant APC challenge.
Comparison of Process Time Related PSD Data Sets
Multiple dM/dLogD plots taken at different times can present a picture of the particle size evolution during a process. Figure 4 shows the graph of two data sets from the same process. Run 1 was collected during the initial few minutes of combustion while Run 2 was collected after the combustion had fully developed. The shifts in the sizes and relative magnitudes of the peaks discussed above are markedly apparent and are indicative of changes in the particle size generation mechanisms as the combustion advances.
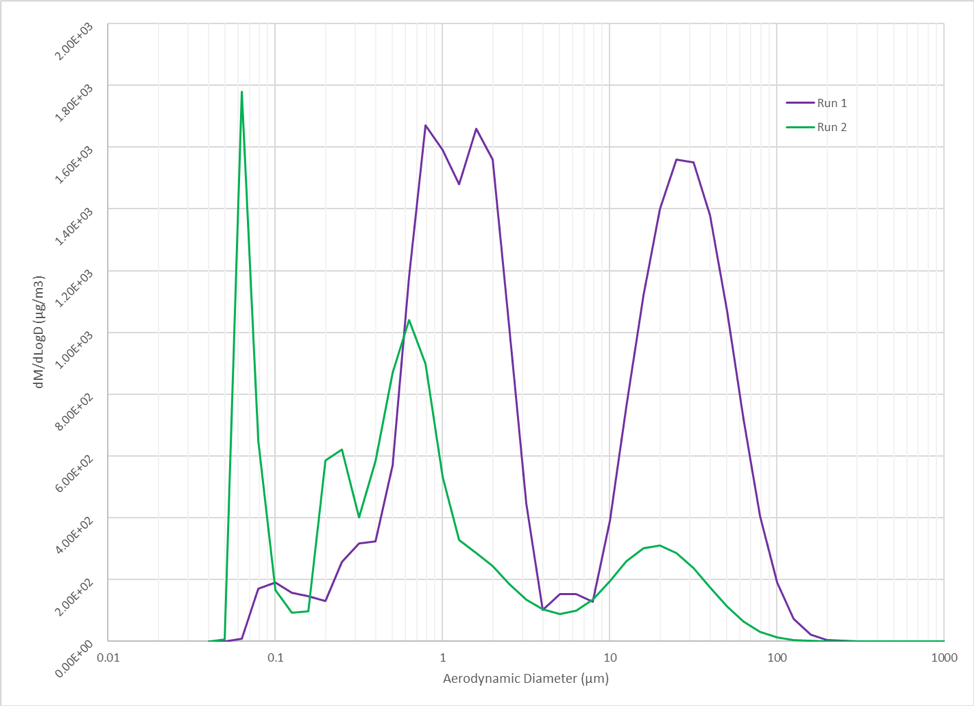
Figure 4: Comparison of Process Time Related PSD Data Sets
SEM Analysis
In addition to regular gravimetric analysis of cascade impactor samples, another analytical tool that can be employed is scanning electron microscopy (SEM). SEM analyses can provide information about the specific morphology and actual size of the collected particulate matter. This tool provides a visual means to distinguish between individual particles and agglomerations of smaller particles acting like a larger particle in the gas stream. Figure 5 shows an SEM photograph of a collected sample of coal fly ash.
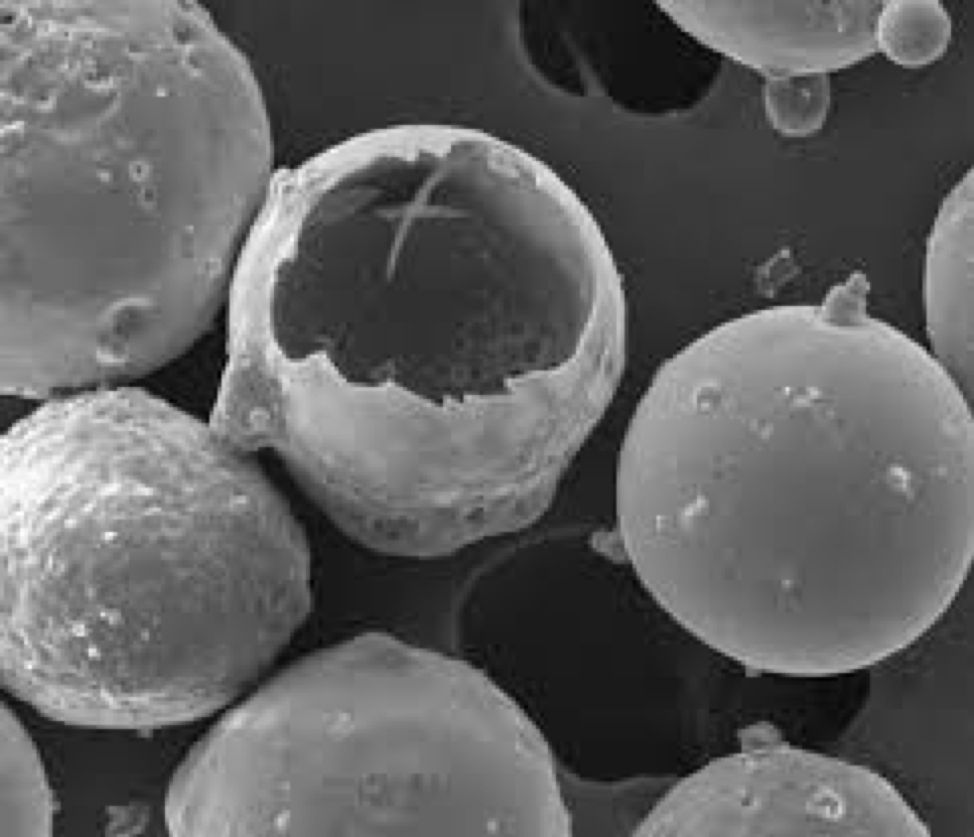
Figure 5: SEM Photo of Coal Fly Ash Cenospheres
Size Specific Chemical Speciation using ICP-MS
In addition to SEM analysis, a variety of other analytical protocols can be applied to the individual recovered substrates to get size-specific chemical speciation. This can be used to correlate one or more specific compounds in the gas stream to each particle size cut-point. This can then be related back to the particle generation mechanism for each cut-point.
Figure 6 is a dM/dLogD plot of a metal coating process. After gravimetric determinations were made, each substrate was analyzed for a selection of target metals by ion coupled plasma – mass spectroscopy (ICP-MS). The result is a separate dM/dLogD plot for each target metal. As expected, the metals in the exhaust gas stream undergo vapor phase condensation to form submicron particles. These ultrafine particles present both a potential health risk as well as a significant challenge for emissions control.
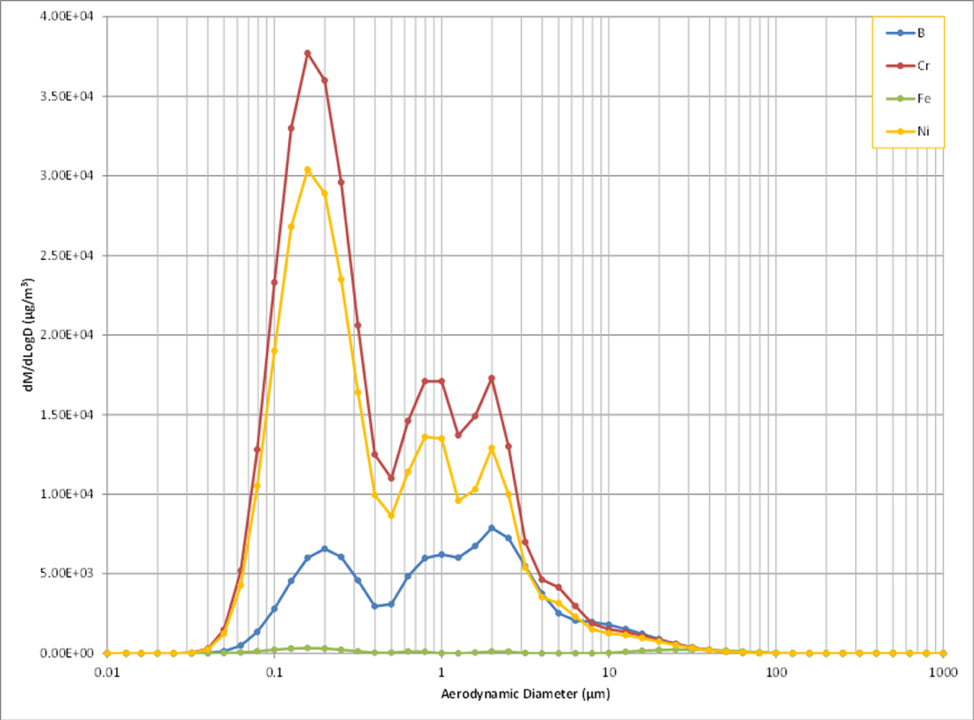
Figure 6: dM/dLogD plot Showing Size Specific Chemical Speciation using ICP-MS
XRD Analysis of a Single Impactor Substrate
Another tool is the use of X-ray diffraction (XRD) analysis of the collected sample on each substrate. XRD provides information about the crystallographic structure and chemical composition of the sample. Figure 7 is an XRD analysis of a substrate that was part of an impactor sample collected downstream of a venturi scrubber demister. This information was used to determine how much gypsum from the scrubber liquor was being lost because of subpar demister performance.
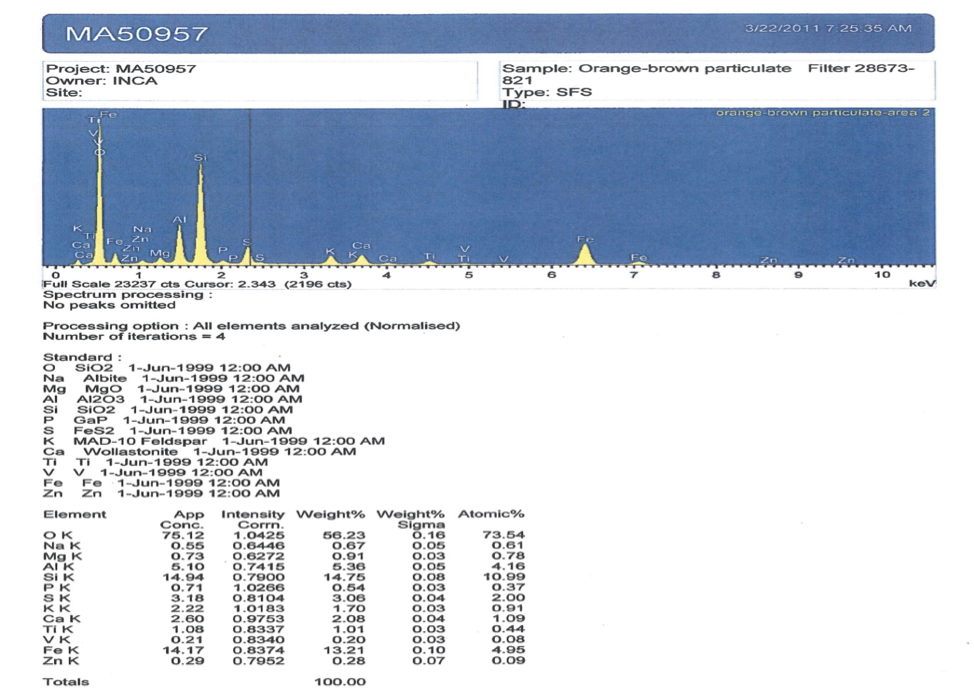
Figure 7: XRD Analysis of a Single Impactor Substrate
The examples presented herein demonstrate some of the information that can be generated from in-situ cascade impactor sampling. This information can help end-users assess the efficacy of their APC equipment or specify new equipment in a more informed and capital sensitive way.
The author of this article was involved with the development of the Pilat, University of Washington impactor as well as other PSD tools. For further information on determining particle size distribution in any type of gas stream, contact jguenthoer@cleanair.com