In-situ particle sizing in “wet” sources:
Can we do it and if so, what can we learn?
In previous posts we have looked at in-situ air measurement techniques to obtain particle size distributions of the particulate matter contained in a gas stream from an industrial process with the focus being on cascade impactors. We’ve seen how in addition to straightforward gravimetric determinations we can obtain time and formation mechanism dependent process information, size specific chemical speciation and size specific morphology.
However, in-situ devices have seldom been used in “wet” sources, wet meaning those with liquid droplets present. In fact, the U.S. EPA’s in-situ sampling method for PM10 and PM2.5, Method 201A, specifically precludes the use of the method in gas streams where droplets are present. There is however a real need to understand wet ESP and scrubber performance as relates to droplet carryover/emission from these types of devices. The particulate matter born by a wet gas stream is not distributed in the same manner as the gas upstream of a wet collection device. There are fine particles that are moving along in the gas stream independent of the water droplets. Along with these fine particles there are water droplets of tens to hundreds of microns in size that contain entrained fine particulate matter of a much smaller actual size.
In most impactors the large (tens of microns) water drops would flood the device rendering the collection of a viable sample impossible. This can be overcome with special accommodations to the impactor to successfully test in saturated gas streams containing liquid droplets and provide clients valuable, heretofore unavailable information.
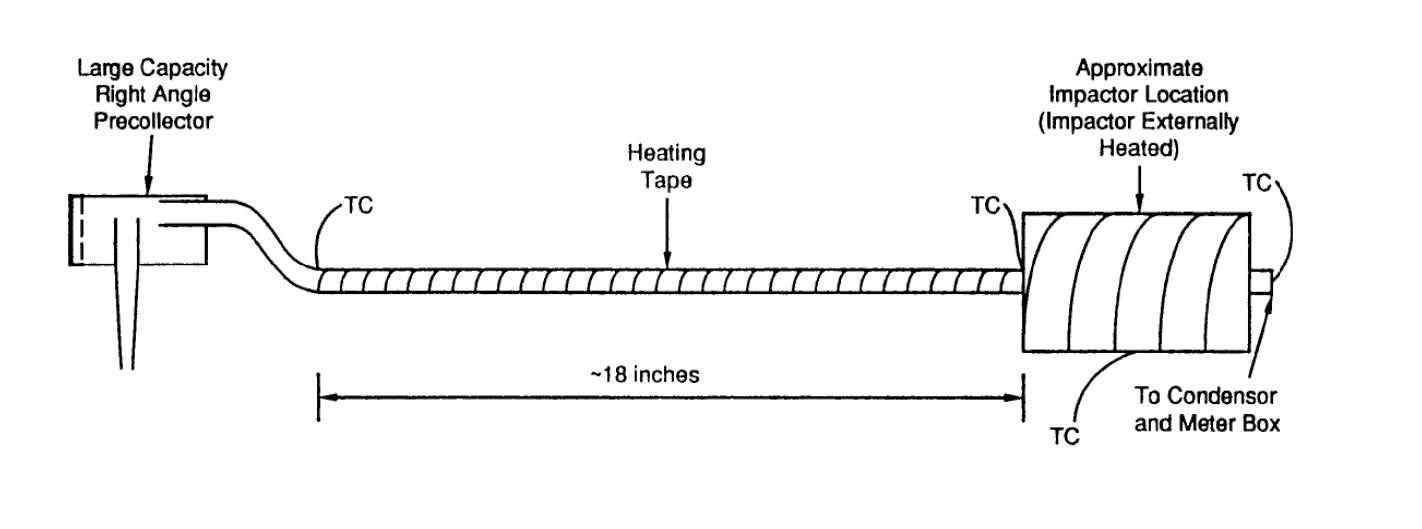
When evaluating how to attempt to perform particle size distribution testing on a wet gas stream the intent of the data needs to be clearly understood. Is it desired to evaluate the size of the PM that will be released to the atmosphere after the plume has evaporated? Do we want to understand what the downstream equipment is “seeing” in the actual gas stream? In the first case the large water droplets that would fall out upon exiting the stack need to be removed from the sampled gas stream. The gas stream then needs to be heated and the droplets evaporated, releasing any droplet entrained particulate matter before entering the impactor in a dry sample stream. This procedure was published in an addendum to California Air Resources Board Method 501, that was developed by Southern Research Institute. Figure 1 is from the referenced addendum showing how the sampling system should be setup for plume simulation testing.
The second case can be more technically challenging because we want to size the droplets as they exist in the gas stream as well as any unentrained particulate matter.
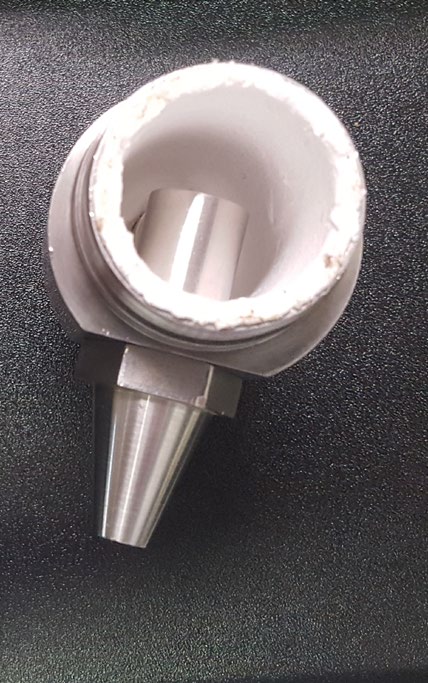
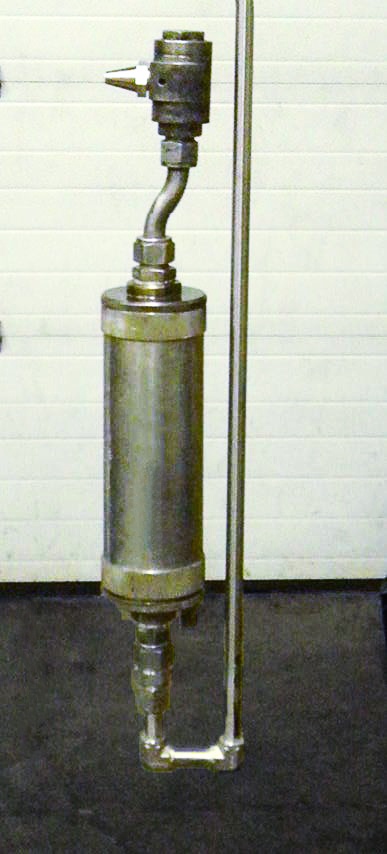
Because of sample port diameter constraints and sample port length, most cascade impactor sampling is performed using an inlet device that enables sampling at right angles to the gas stream and still allows specific particle size determination to be made in that configuration. The most commonly used right angle pre-cutter head, developed by Dr. Joe McCain at Southern Research Institute, which acts as the inlet section of the impactor is normally an empty, dry collection device. The Pollution Control Systems Corporation (PCSC) precutter, developed by Mr. Jim Guenthoer in cooperation with the late Mr. Don Russell of Russell Engineering, Inc., is a modified version of the original SoRI device that has an interior diameter that can accept a CleanAir proprietary liner for wet particle sizing that absorbs the large (relative to the PM size) water drops that enter the impactor and keeps them from shattering and flooding the lower stages of the impactor. Figure 2 shows a PCSC precutter with the inner liner for droplet removal. Figure 3 shows a University of Washington Mark V impactor with a liner containing PCSC precutter mounted on it, setup for sampling a large droplet bearing horizontal duct.
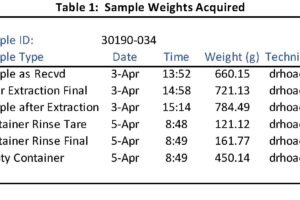
In order to assist in differentiating between water entrained and gas-borne particulate matter, the impactor substrates are weighed “wet” onsite as they are removed from the impactors. The substrates then undergo normal post test drying protocol to derive a dry weight of collected particulate matter. A graphic comparison of wet weights and dry weights from a sample collected at the outlet of an FGD mist eliminator that shows the significant import of the data is presented in Figure 4.
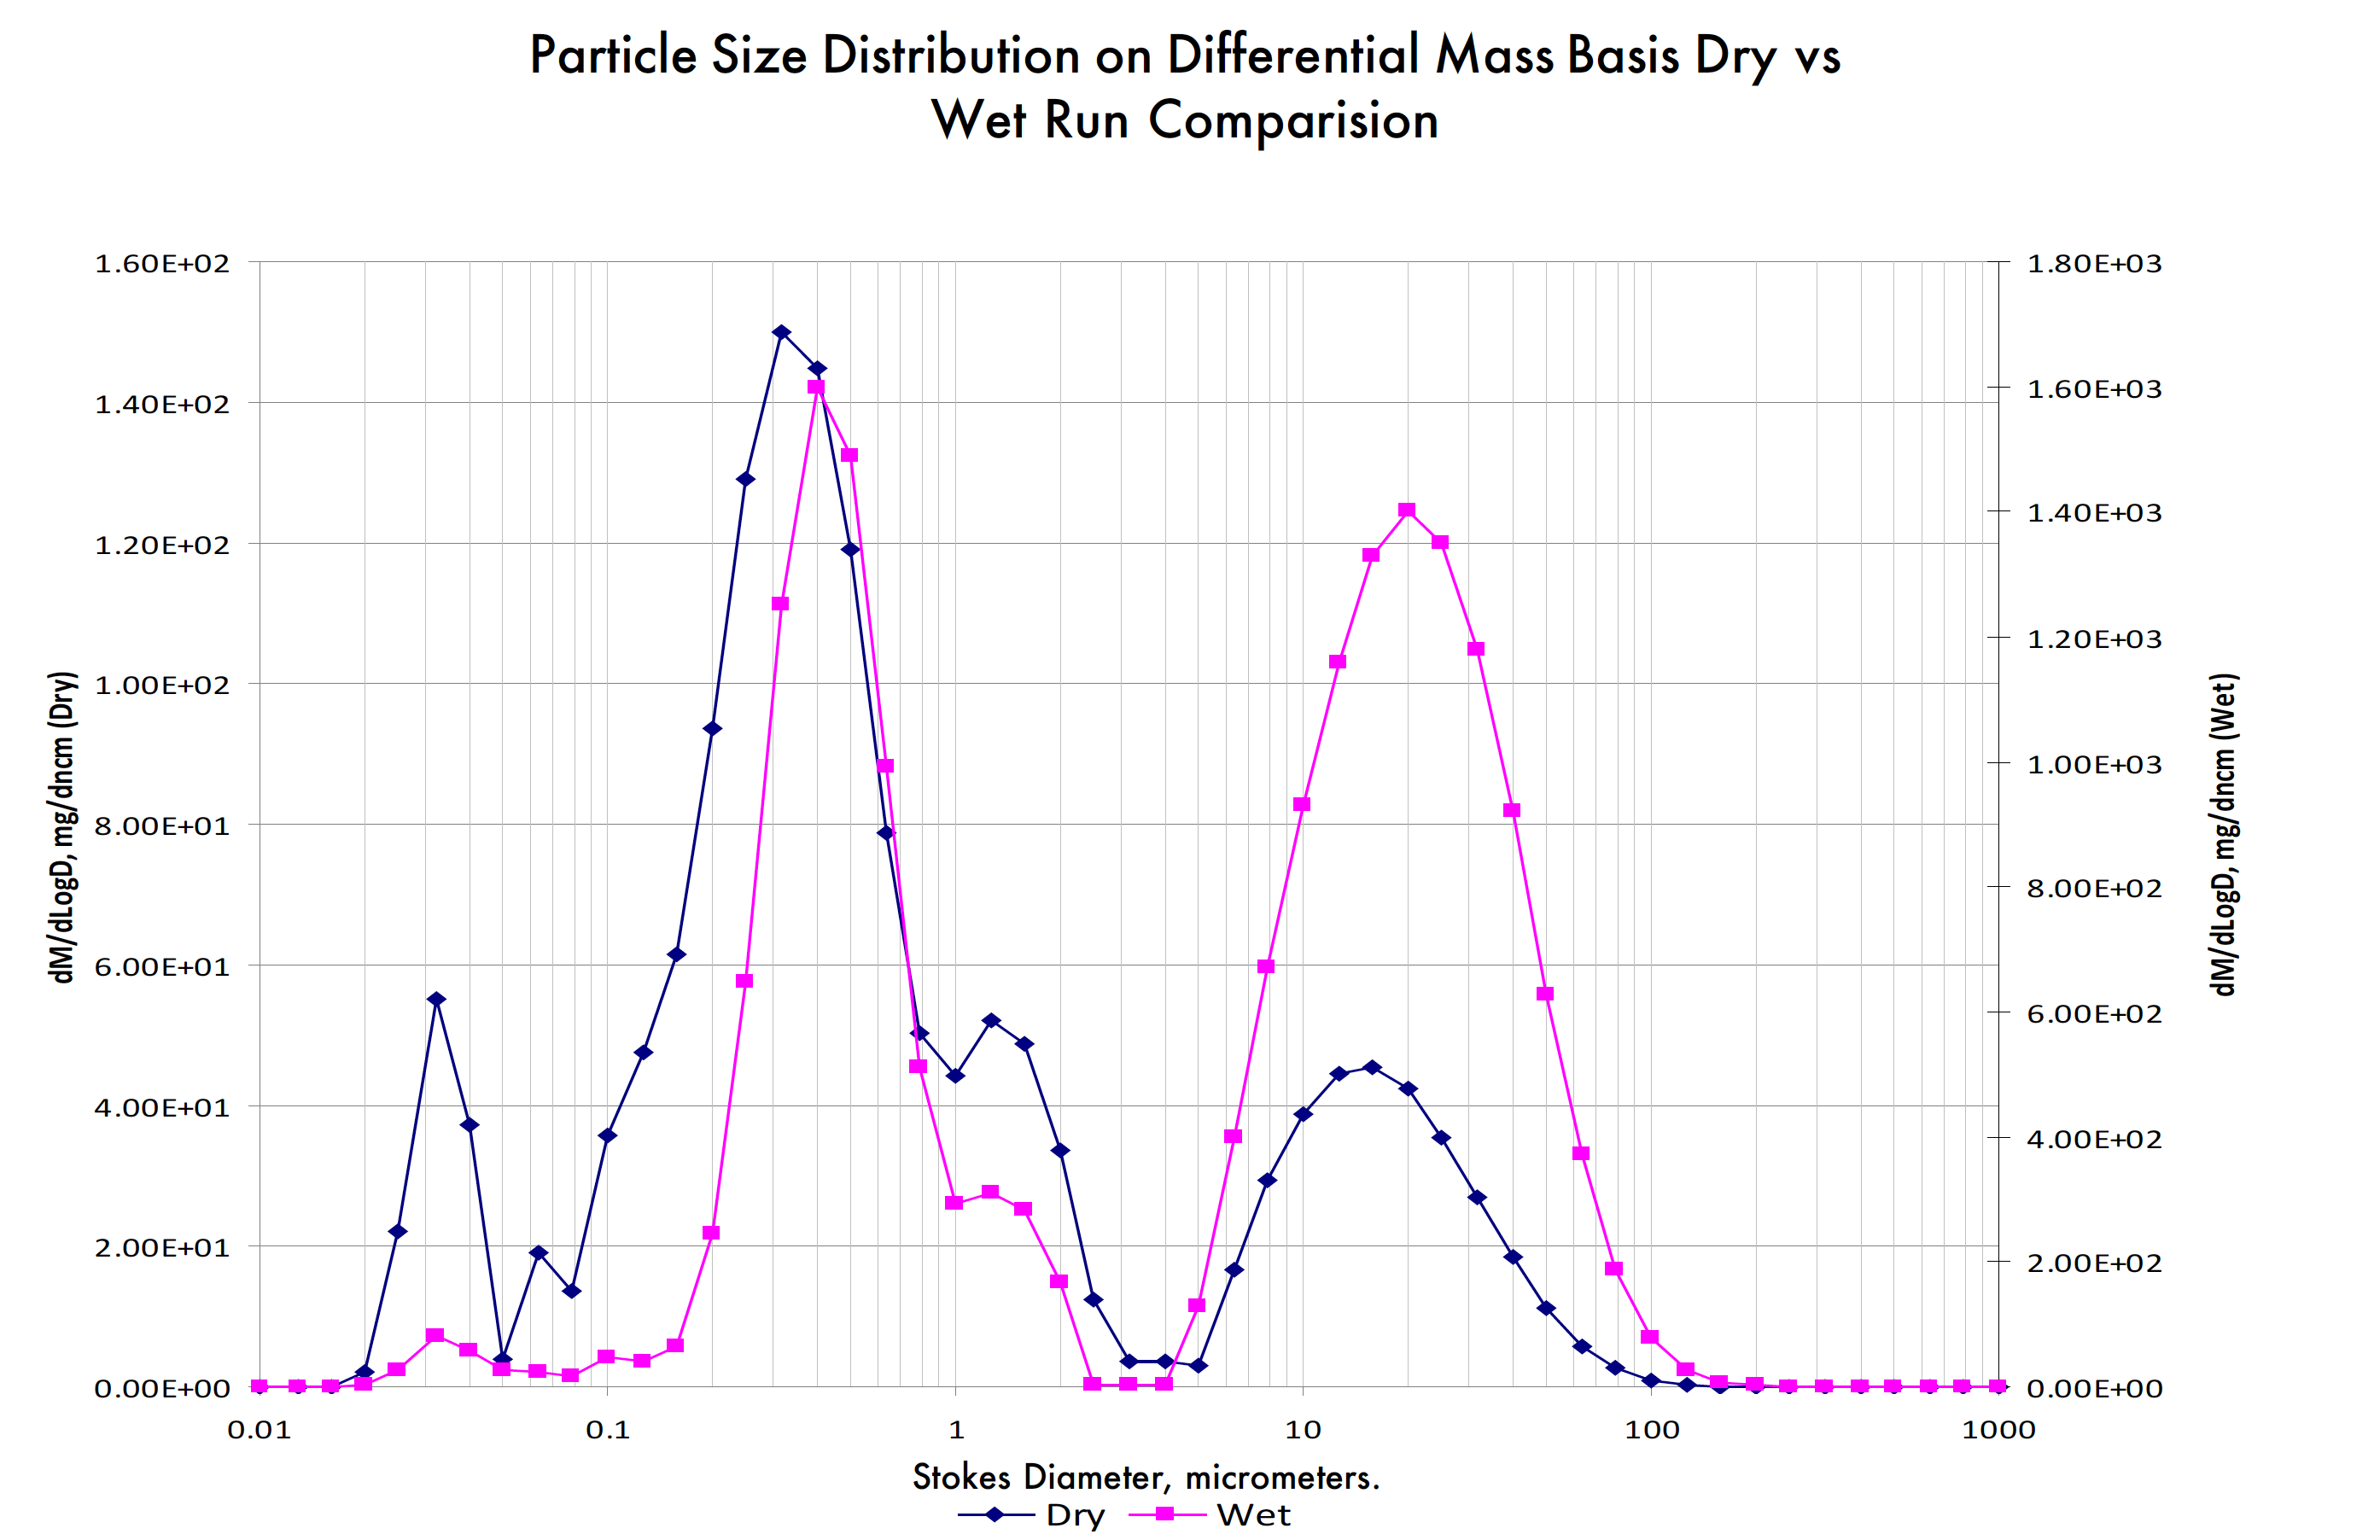
The dMdLogD plot presents the mass concentration with respect to particle size on the Y-axis. The particle size is on the logarithmic X-axis. By using a linear scale for the Y-axis the area under the curve between two particle sizes equals the total concentration between the diameters. This type of plot is frequently used to demonstrate where the mass of material is with respect to particle size which affects the necessary control equipment design to achieve emissions limits. The wet plot shows what appears to be a bimodal distribution of almost equal masses of particles around 20 microns size and 0.4 microns size. However, when the samples are dried and reweighed the “large” particle concentration has diminished significantly with respect to the smaller particles whose magnitude in the total sample remains essentially the same. This indicates that the large wet peak was composed of largely of water with a smaller relative fraction of entrained particulate matter residue that remains after the water is removed. The small size diameter peak reflects untrained particulate matter that was wet, then dried but did not alter the relationship between the samples as exemplified by the larger peak. The lesson learned here of course is that if the mist eliminator was not allowing those drops to be re-entrained in the gas stream that particulate matter residue would not be in the gas stream affecting any downstream hardware and being emitted from the stack as particulate matter.
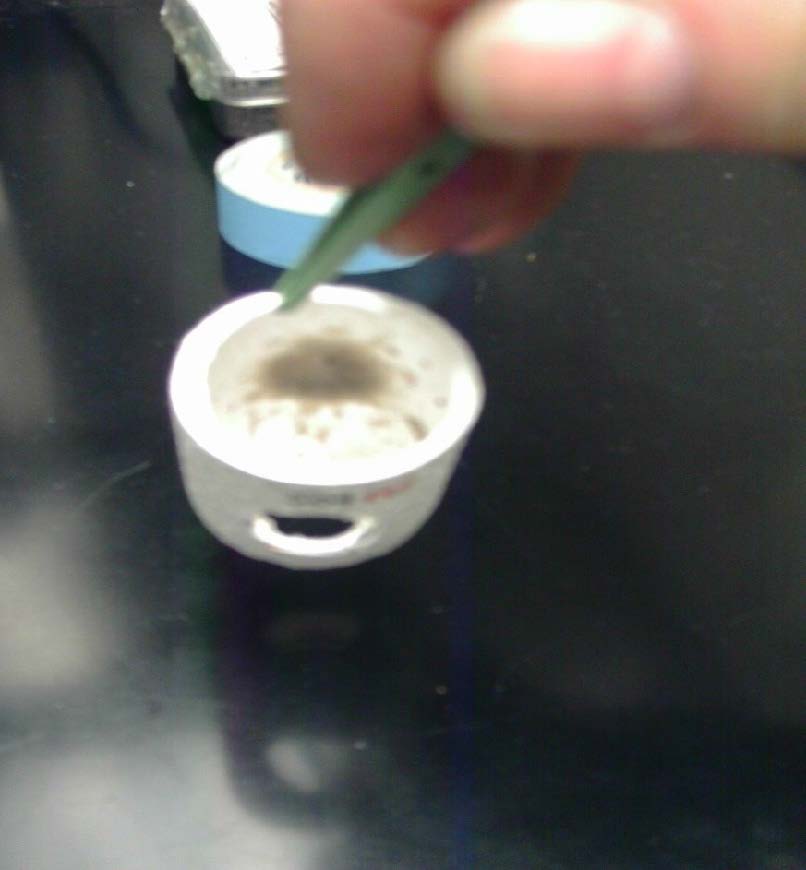
Figure 5 is a photograph of a pre-cutter liner that was used on the FGD outlet particle size distribution test graphed in Figure 3. You can see the dark particulate matter residue deposited when the water drops struck the liner and were absorbed.
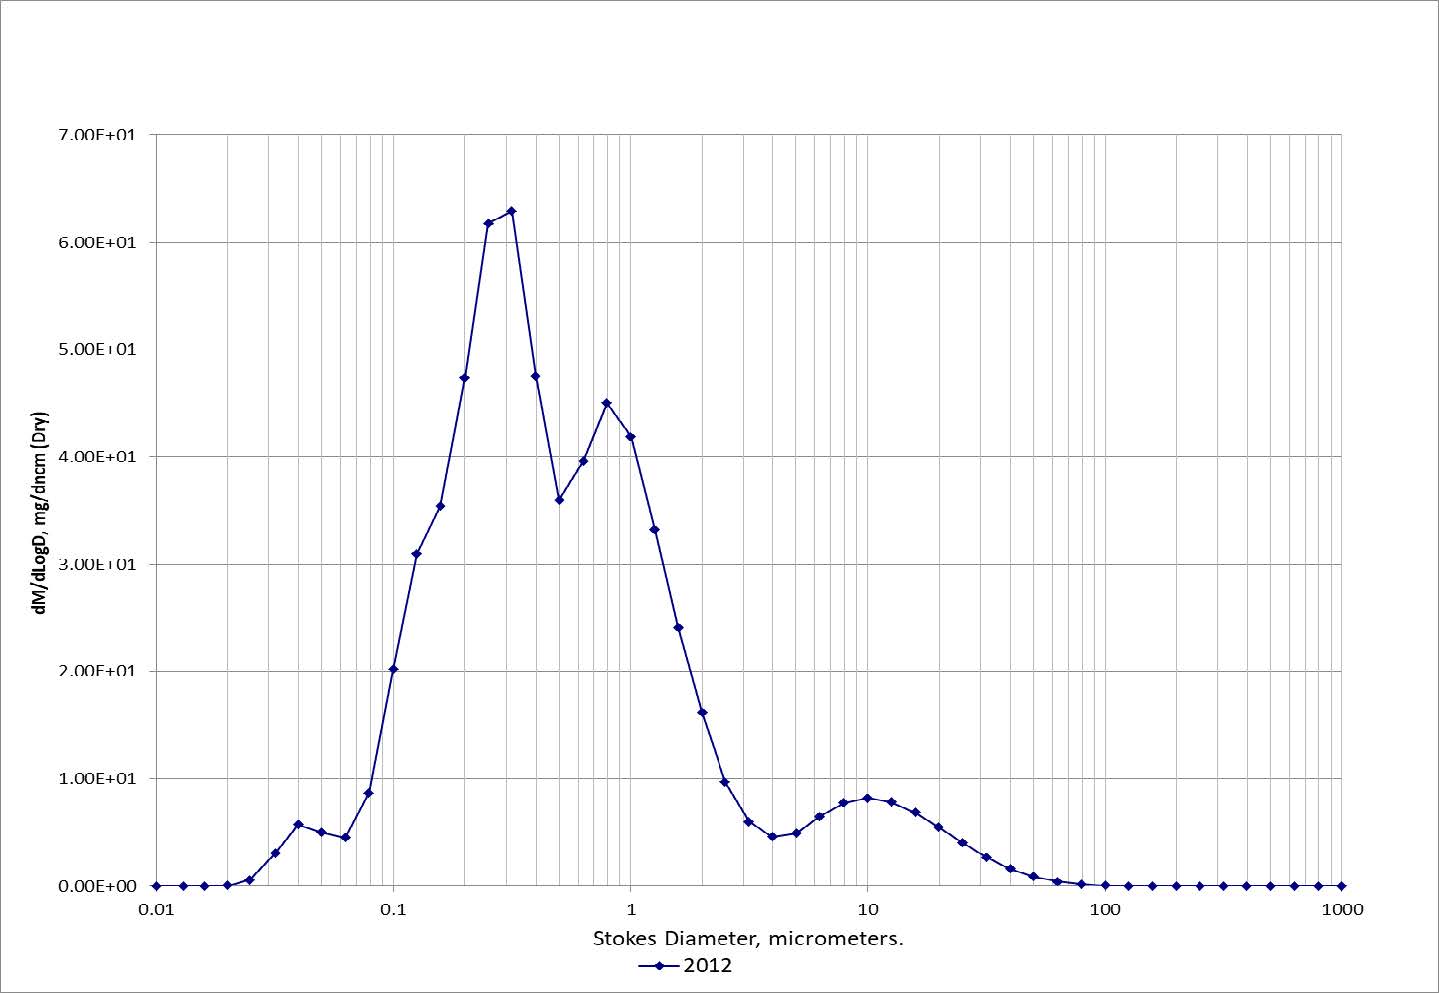
Based on the information gathered during the initial testing shown in Figure 3 the facility in question repaired their demisters. Figure 6 shows the dried basis particle size distribution at the same location after the repairs. We can see how the droplet born PM peak has been significantly reduced, lowering the source’s overall PM emissions.
So as field trials have shown, it is possible to perform in-situ particle size distribution testing in a droplet laden gas stream. It does require the specially developed sampling accommodations and modifications and the expertise to use them.
The author of this blog post was involved with the development of the Pilat, University of Washington impactor and the PCSC precutter as well as other PSD tools. For further information on determining particle size distribution in any type of gas stream, contact jguenthoer@cleanair.com
Related posts